

Smarten: eCommerce Analytics
Augmented Analytics and Reporting Integrated with eCommerce
Developed by Elegant MicroWeb Technologies Pvt. Ltd
Screenshots
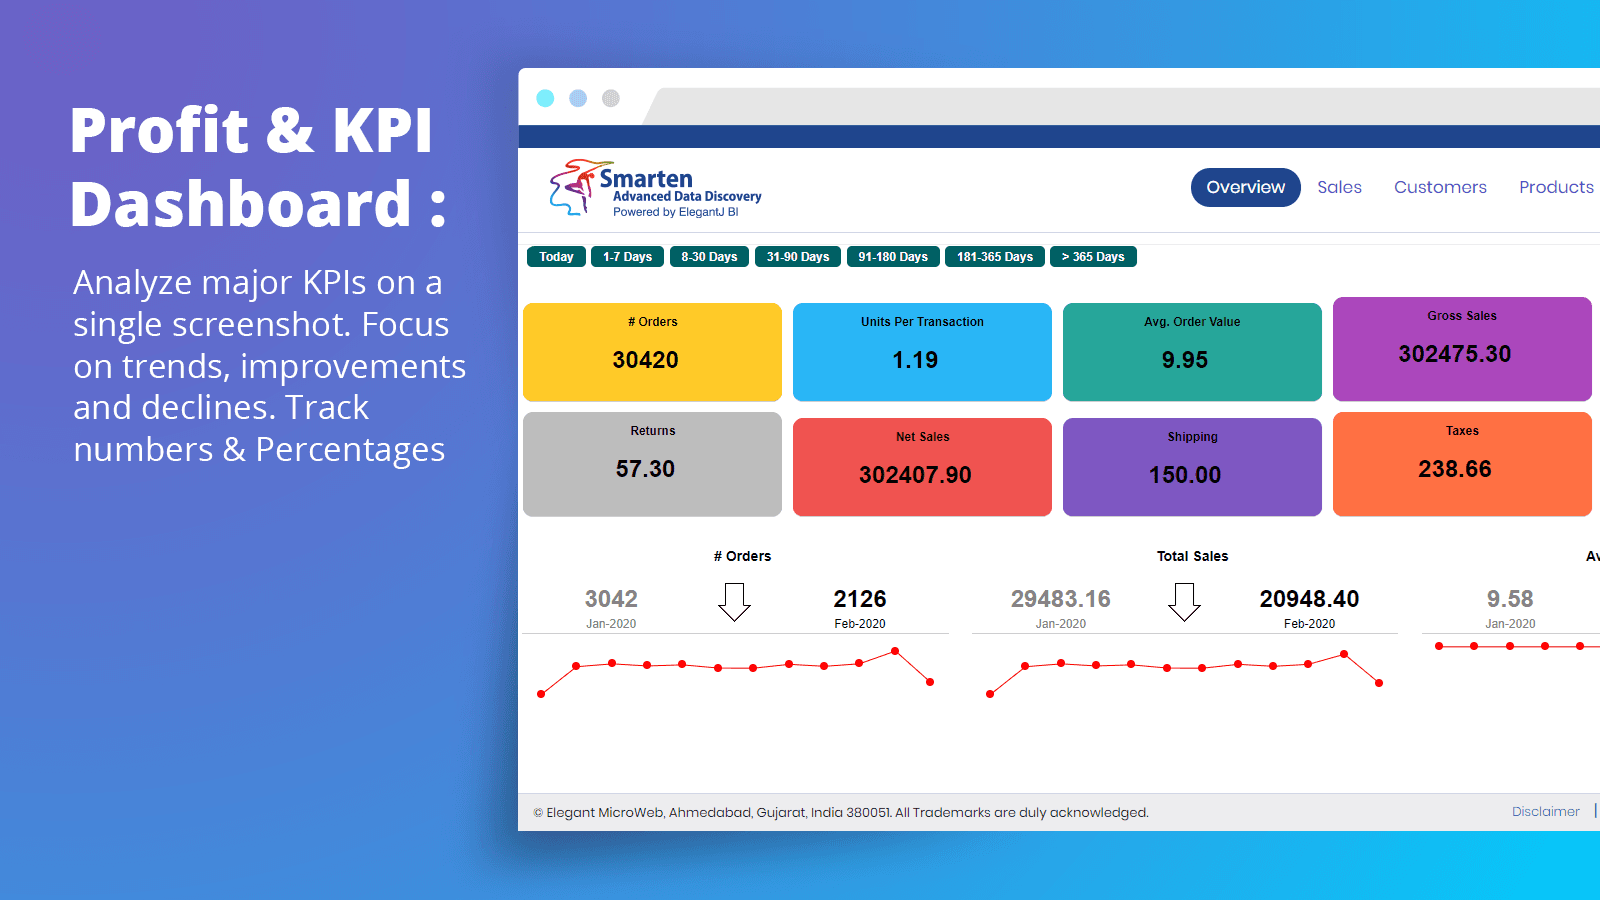
About Smarten: eCommerce Analytics Make Fact-Based Decisions, Solve Problems & Identify Opportunities with Clear Reporting & Metrics With Smarten eCommerce Analytics, users gain insight into data in a unique and meaningful way! The app provides the value of analytics integration and fact-based decision-making. Users enjoy seamless login and registration. Within minutes users will see eCommerce data in Smarten with prebuilt analytics templates. Choose from one of three flexible pricing plans (Silver, Gold and Platinum) to suit your needs. Accredited by Gartner and recognized for its intuitive, easy-to-use analytics, Smarten offers stunning visualization, dynamic charts and graphs and key performance indicators (KPIs) metrics to help you sustain a competitive edge. Smarten goes far beyond Visual Analytics tools that simply monitor data. The Smarten app reimagines analytics with out-of-the-box reports and dashboards that dive deep into data, drill down and through data and allow users to interact with data to make data-driven decisions. Smarten eCommerce Analytics provides value out-of-the-box with vital eCommerce dashboards and reports to manage business health and identify opportunities to expand and grow your eCommerce business. It provides sales reports, sales trends and sales contribution, advanced key performance indicators (KPIs) and analytics to reveal Customer Lifetime value (LTV), Customer Cohorts, Customer Loyalty and Product Cross Sell. Smarten Pre-Built Analytics Features Include: Sales Overview Overview of sales performance including the number of orders, Average Order value per customer, Gross, Net and Total Sales and expenses for Discount, Shipping and Taxes. Daily Sales Trends KPIs, Daily, Weekly and Cumulative Sales to manage and monitor performance and reveal performance by country, brand, customer. Monitors cart abandonment and recovery, product return by month, country, etc. Customer Dashboards Track KPIs by customers maximum orders, average customer order and customer values, customers with the most returns. Customer Lifetime Value Users can track orders per month placed by a set of customers and the value. Determine how long a customer stays on the site and the lifetime value for a period. Understand customer loyalty and identify customers who ordered the most items and the period of time during which orders were placed. Product Dashboard Review and manage data regarding most frequently ordered products, brands, product variables, etc. BI Reports All dashboards allow for drill down analysis and offer ready-to-use reports to view and export data using CSV. Sales by Country, Brand, SKU, Customer and Source New vs Returning Customers by Country Merchants can request new reports at additional cost
Key Features
Smarten: eCommerce Analytics FAQs
No. Smarten: eCommerce Analytics pricing starts at $19. For more details about Smarten: eCommerce Analytics pricing, check here.

Get in Touch
with us
Whether you need more information on how LetsMetrix can help enhance your Shopify experience, or require technical support, don't hesitate to contact us. We're available 24/7 via email, phone, or live chat to ensure you have all the assistance you need.