

Screenshots
1 / 6
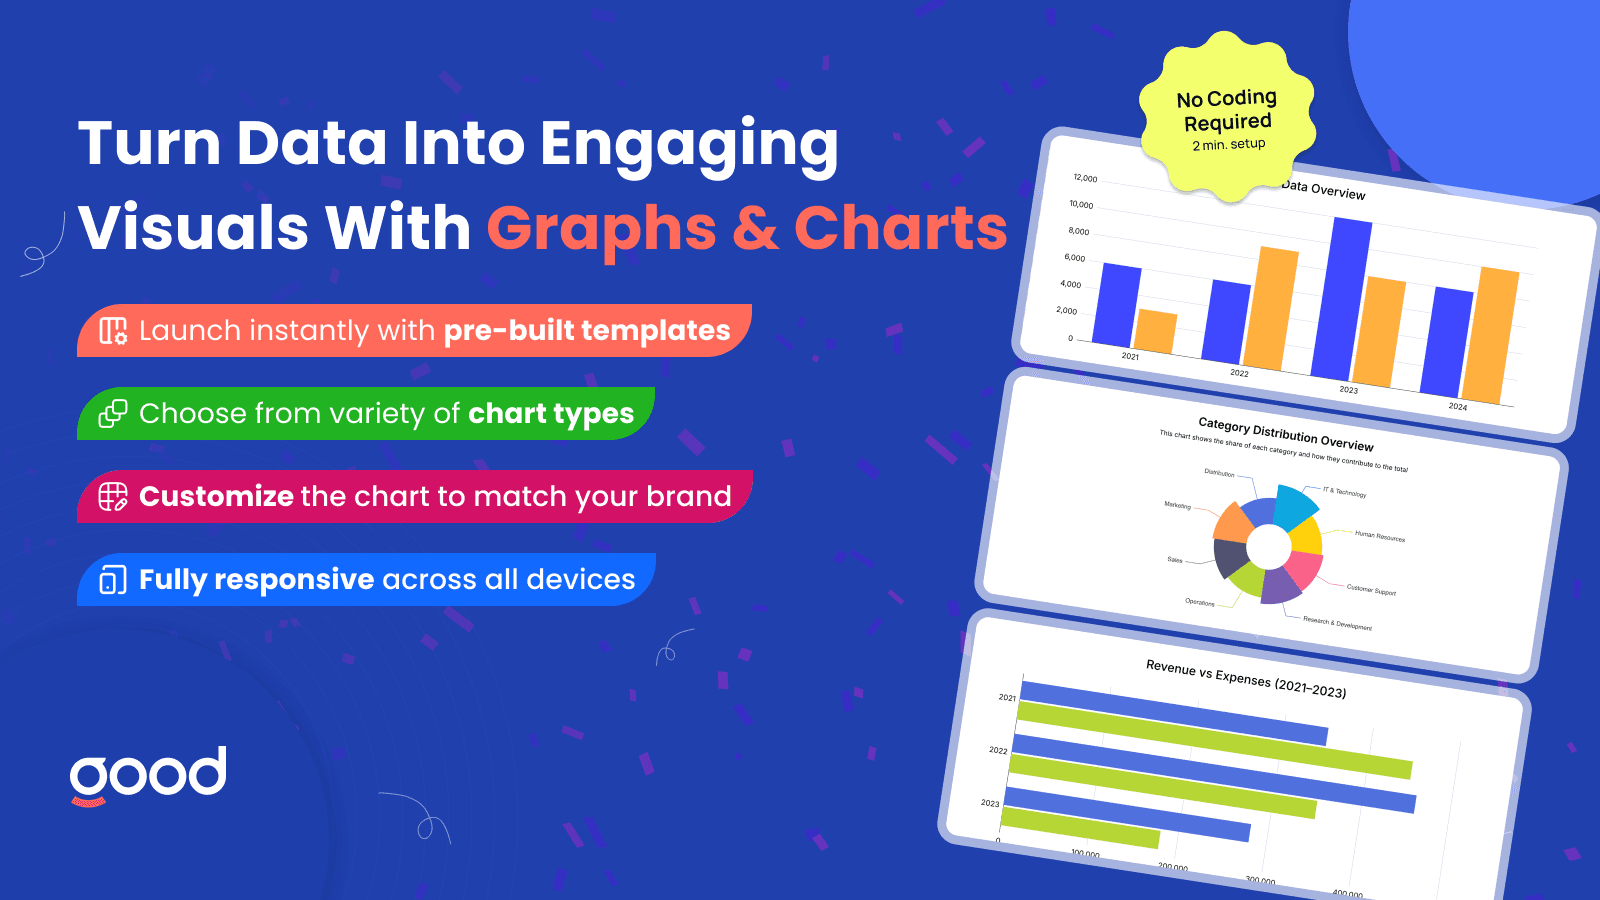
Turn raw store data into engaging visuals that inspire trust and drive sales.
Graphs & Charts helps you communicate data visually — making complex numbers easy to understand and engaging to look at. From product comparisons to sales progress, you can create beautiful, responsive charts or sell graphics that blend seamlessly with your store design. Choose from 16 chart types and customize every detail to fit your brand’s aesthetic and goals. Perfect for showcasing transparency, tracking performance, or adding visual storytelling to your content.
Key Features
- Bar, diagram, line, donut, radar, or interactive charts to data visualization
- Adjust colors, fonts, and layouts to match your store’s visual identity
- Launch stunning charts instantly with pre-built design presets
- Add charts to product pages, blogs, landing pages, or promotional sections
- All charts adapt perfectly across desktop, tablet, and mobile devices
Best alternatives to GA: AI Graph & Charts
GA: Timeline
5(7)
From $5.99/month. Free trial available.
Create time line and history timeline that tell your story
GA: AI Graph & Charts FAQs
No. GA: AI Graph & Charts pricing starts at N/A. For more details about GA: AI Graph & Charts pricing, check here.