

Sales & Inventory Dashboard
Specialized analysis to make sense of sales & inventory data.
Developed by Pulse Retail Systems
Screenshots
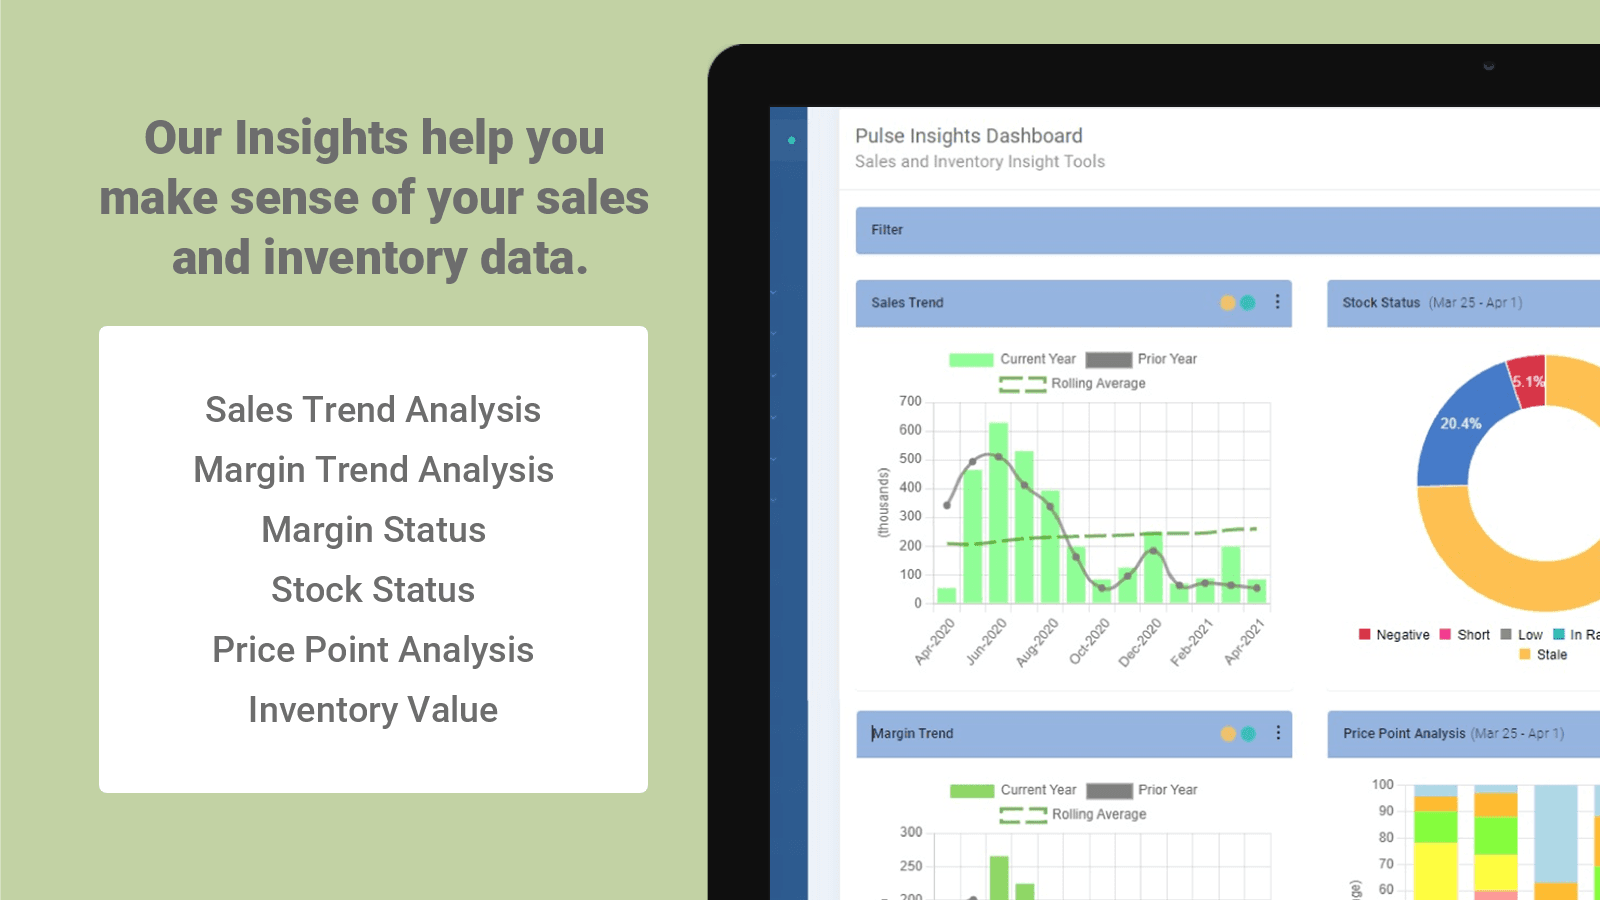
Our Insights provides specialized analysis to help you analyze your sales and inventory performance.
Specialized analysis to help you make sense of your sales and inventory data and allow you to make critical decisions when they need to be made. We help you: * Analyze 12-month sales & margin trends with prior year & rolling average comparisons. * Evaluate purchase patterns using our price point analysis. * Identify outperforming & underperforming products by analyzing your inventory stock levels. * View actual % margin products are generating. * View a breakdown of current inventory values.
Key Features
- Dashboard for at-a-glance graphical analysis of your sales and inventory.
- Charts provide clarity for sales & margin trends and stock requiring attention.
- Data grids provide detail behind the charts with grouping, sorting and export.
- Advanced analysis with filtering by groups, departments, locations and more.
- Automated scheduled data synchronization with paid subscriptions.
Best alternatives to Sales & Inventory Dashboard
Datma Product Tracking & CR
Commercial analytics powered by shopper behavior data
Propel Replay, Survey, Heatmap
Fix lost sales: record session replays, heatmaps, AI analytics
Microsoft Clarity: AI Insights
Optimize conversions with AI analytics, recordings, heatmaps
Sales & Inventory Dashboard FAQs
No. Sales & Inventory Dashboard pricing starts at N/A. For more details about Sales & Inventory Dashboard pricing, check here.