

Screenshots
1 / 3
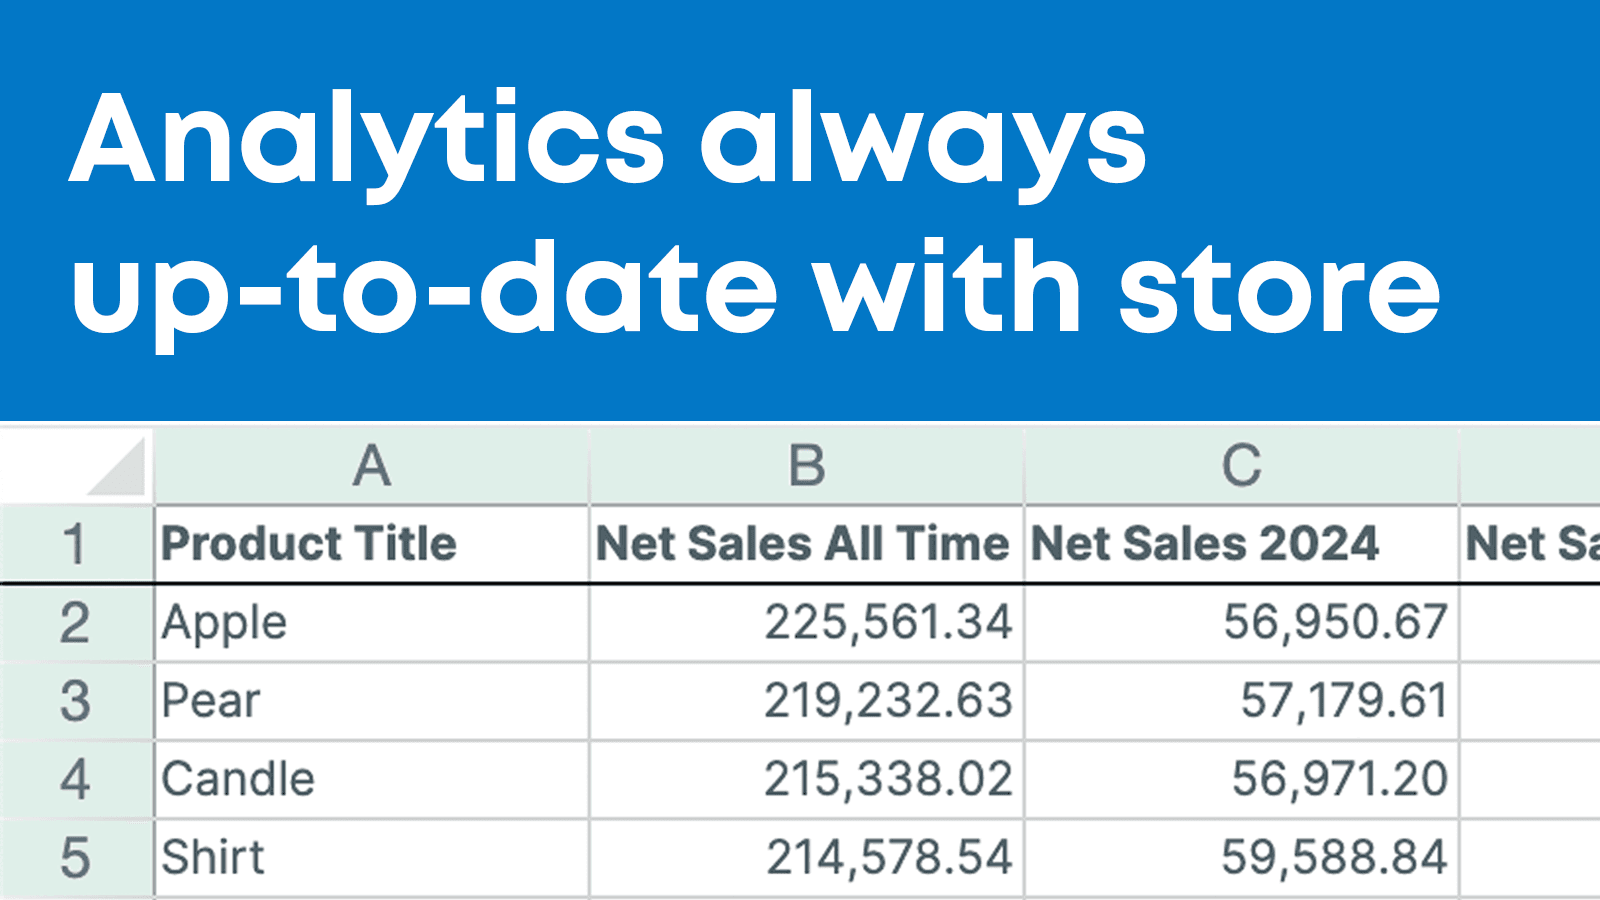
Get real-time sales, product, and customer analytics in a familiar Excel-like spreadsheet
Getting on top of your store analytics shouldn't require complex tools or manual exports. Mixtable Analytics Spreadsheet brings real-time sales, product, and customer analytics directly into a familiar Excel-like spreadsheet. Analytics update automatically as new orders are placed, so your data is always current. Drill into metrics by product, variant, collection, or customer segment, and build custom reporting worksheets using Excel-style formulas.
Key Features
- Real-time store analytics in an Excel-like spreadsheet, including formulas
- Analytics update automatically as new orders are placed in your store
- Drill into metrics by product, variant, collection, customers, vendor, and more
- Build custom reporting worksheets with aggregate metrics across your store
- Export your analytics spreadsheet to Excel or individual worksheets to CSV
Best alternatives to Mixtable Analytics Spreadsheet
Free plan available. Free trial available.
Track Facebook Pixel, Meta Pixel, TikTok Pixel w/ CAPI & Feed
Data Export IO: Reports
5(1939)
From $7/month. Free trial available.
Easy premade and custom reports: filter, schedule, and more.
Mixtable Analytics Spreadsheet FAQs
No. Mixtable Analytics Spreadsheet pricing starts at N/A. For more details about Mixtable Analytics Spreadsheet pricing, check here.