

Viz BI
0• 0 reviews
Analyse sales, profit and more with interactive dashboards
Developed by Wentworth Analytics Ltd.
Screenshots
1 / 5
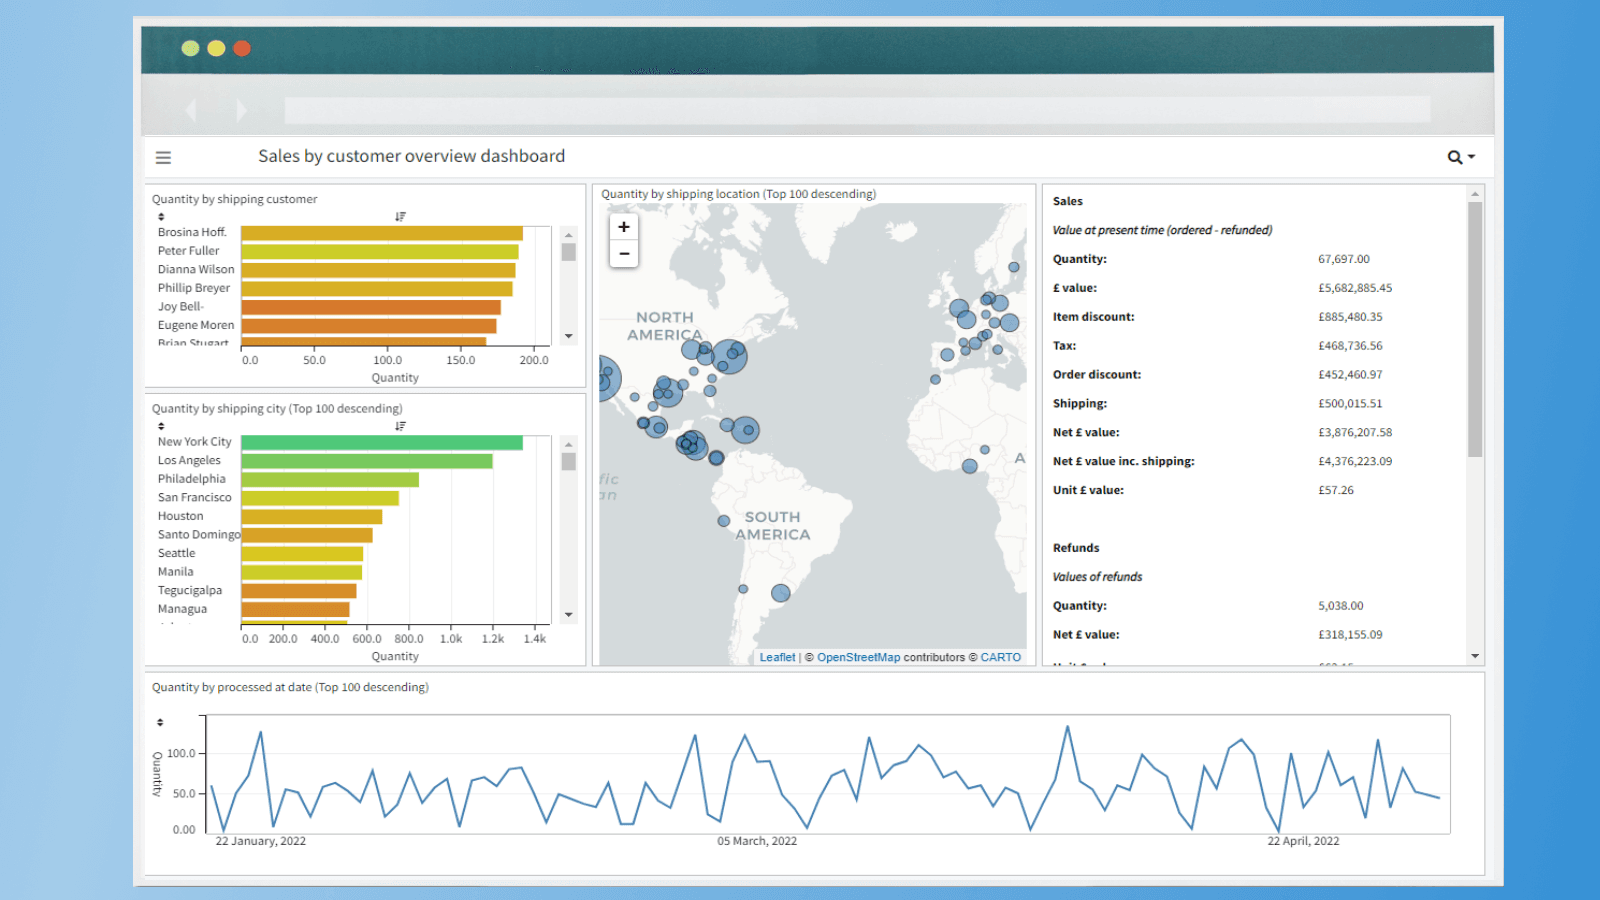
Viz BI provides a series of intuitive dashboards, allowing you to easily understand your store data
Viz BI takes your store data - orders, products, customers and more - and transforms it into interactive, easy to understand charts. These charts are then combined into dashboards, providing you with a full picture of your stores performance across a whole range of attributes. Within a matter of clicks you can : • follow which products are trending and which are falling • identify problem items that keep being returned • keep check of inventory, ensuring top sellers are always available
Key Features
- Track and compare performance across date periods of your choice
- Interactive charts means one click of a bar will filter the whole dashboard
- Simply switch your chart values between sales values, quantities, refunds + more
Best alternatives to Viz BI
Inventory Management ‑ Assisty
4.8(345)
Free plan available. Free trial available.
Smart Inventory Management with AI-Powered Reorder Suggestions